
Manager Dashboard
Gone are the days of drowning in a sea of sticky notes
Project Brief
Enhance and facilitate managerial tasks by developing an intelligent AI-powered experience that streamlines the process for managers to quickly understand the immediate and long-term needs of their direct reports, enabling them to take prompt and informed actions.
The success of Access Portal then sparked the question: How might we enhance Access Portal for Managers?
Challenge
Or better yet, can we create a centralized hub specifically for manager level employees? The justification of this decision came about after conducting a few interviews with manager level employees at Groupe. In understanding their needs, we felt that creating a dedicated and centralized user experience for manager-level employees would offer a distinct advantage over integrating it into Access Portal. This approach would ensure focused attention on the specific needs of managers and their direct reports, enhancing user engagement and understanding. By avoiding integration into the broader Access Portal experience, this dedicated dashboard could be tailored to the unique requirements of managerial tasks, providing a more efficient and user-friendly solution.


Discovery
The key considerations that played a role in the research process were:
Intelligence-led: How can we make all aspects of the dashboard provide insights, not just data? One benefit of providing AI-powered insights over raw data lies in delivering actionable and contextualized information, empowering users to make informed decisions and derive meaningful value from the data.
Hick’s Law: Instead of dropping employees into another portal, opting for a dashboard layout would provide a concise and visually intuitive display of key data and metrics, offering immediate insights. A portal on the other hand, typically serves as a broader access point with various functionalities, making a dashboard more focused and efficient for quick decision-making. This would allow for breaking complex tasks into smaller steps in order to decrease cognitive load and ultimately save time.
Flexibility & Scalability: How to accommodate near and long term mindsets for the individual manager as well as how they engage with their reports. We would need to consider all use cases around managers with as few as one direct report as well as those that have 50+ direct reports.
Efficiency: How do we leverage collapse and expand states to help reduce the noise that some of the more operational data brings.
Design Process
The design timeline for Manager Dashboard lasted about seven months, beginning with the Discovery phase and concluding with the launch. Similar to Access Portal’s design cadence, I collaborated in two-week sprints, actively incorporating feedback from team members, product managers, and stakeholders along the way.
-
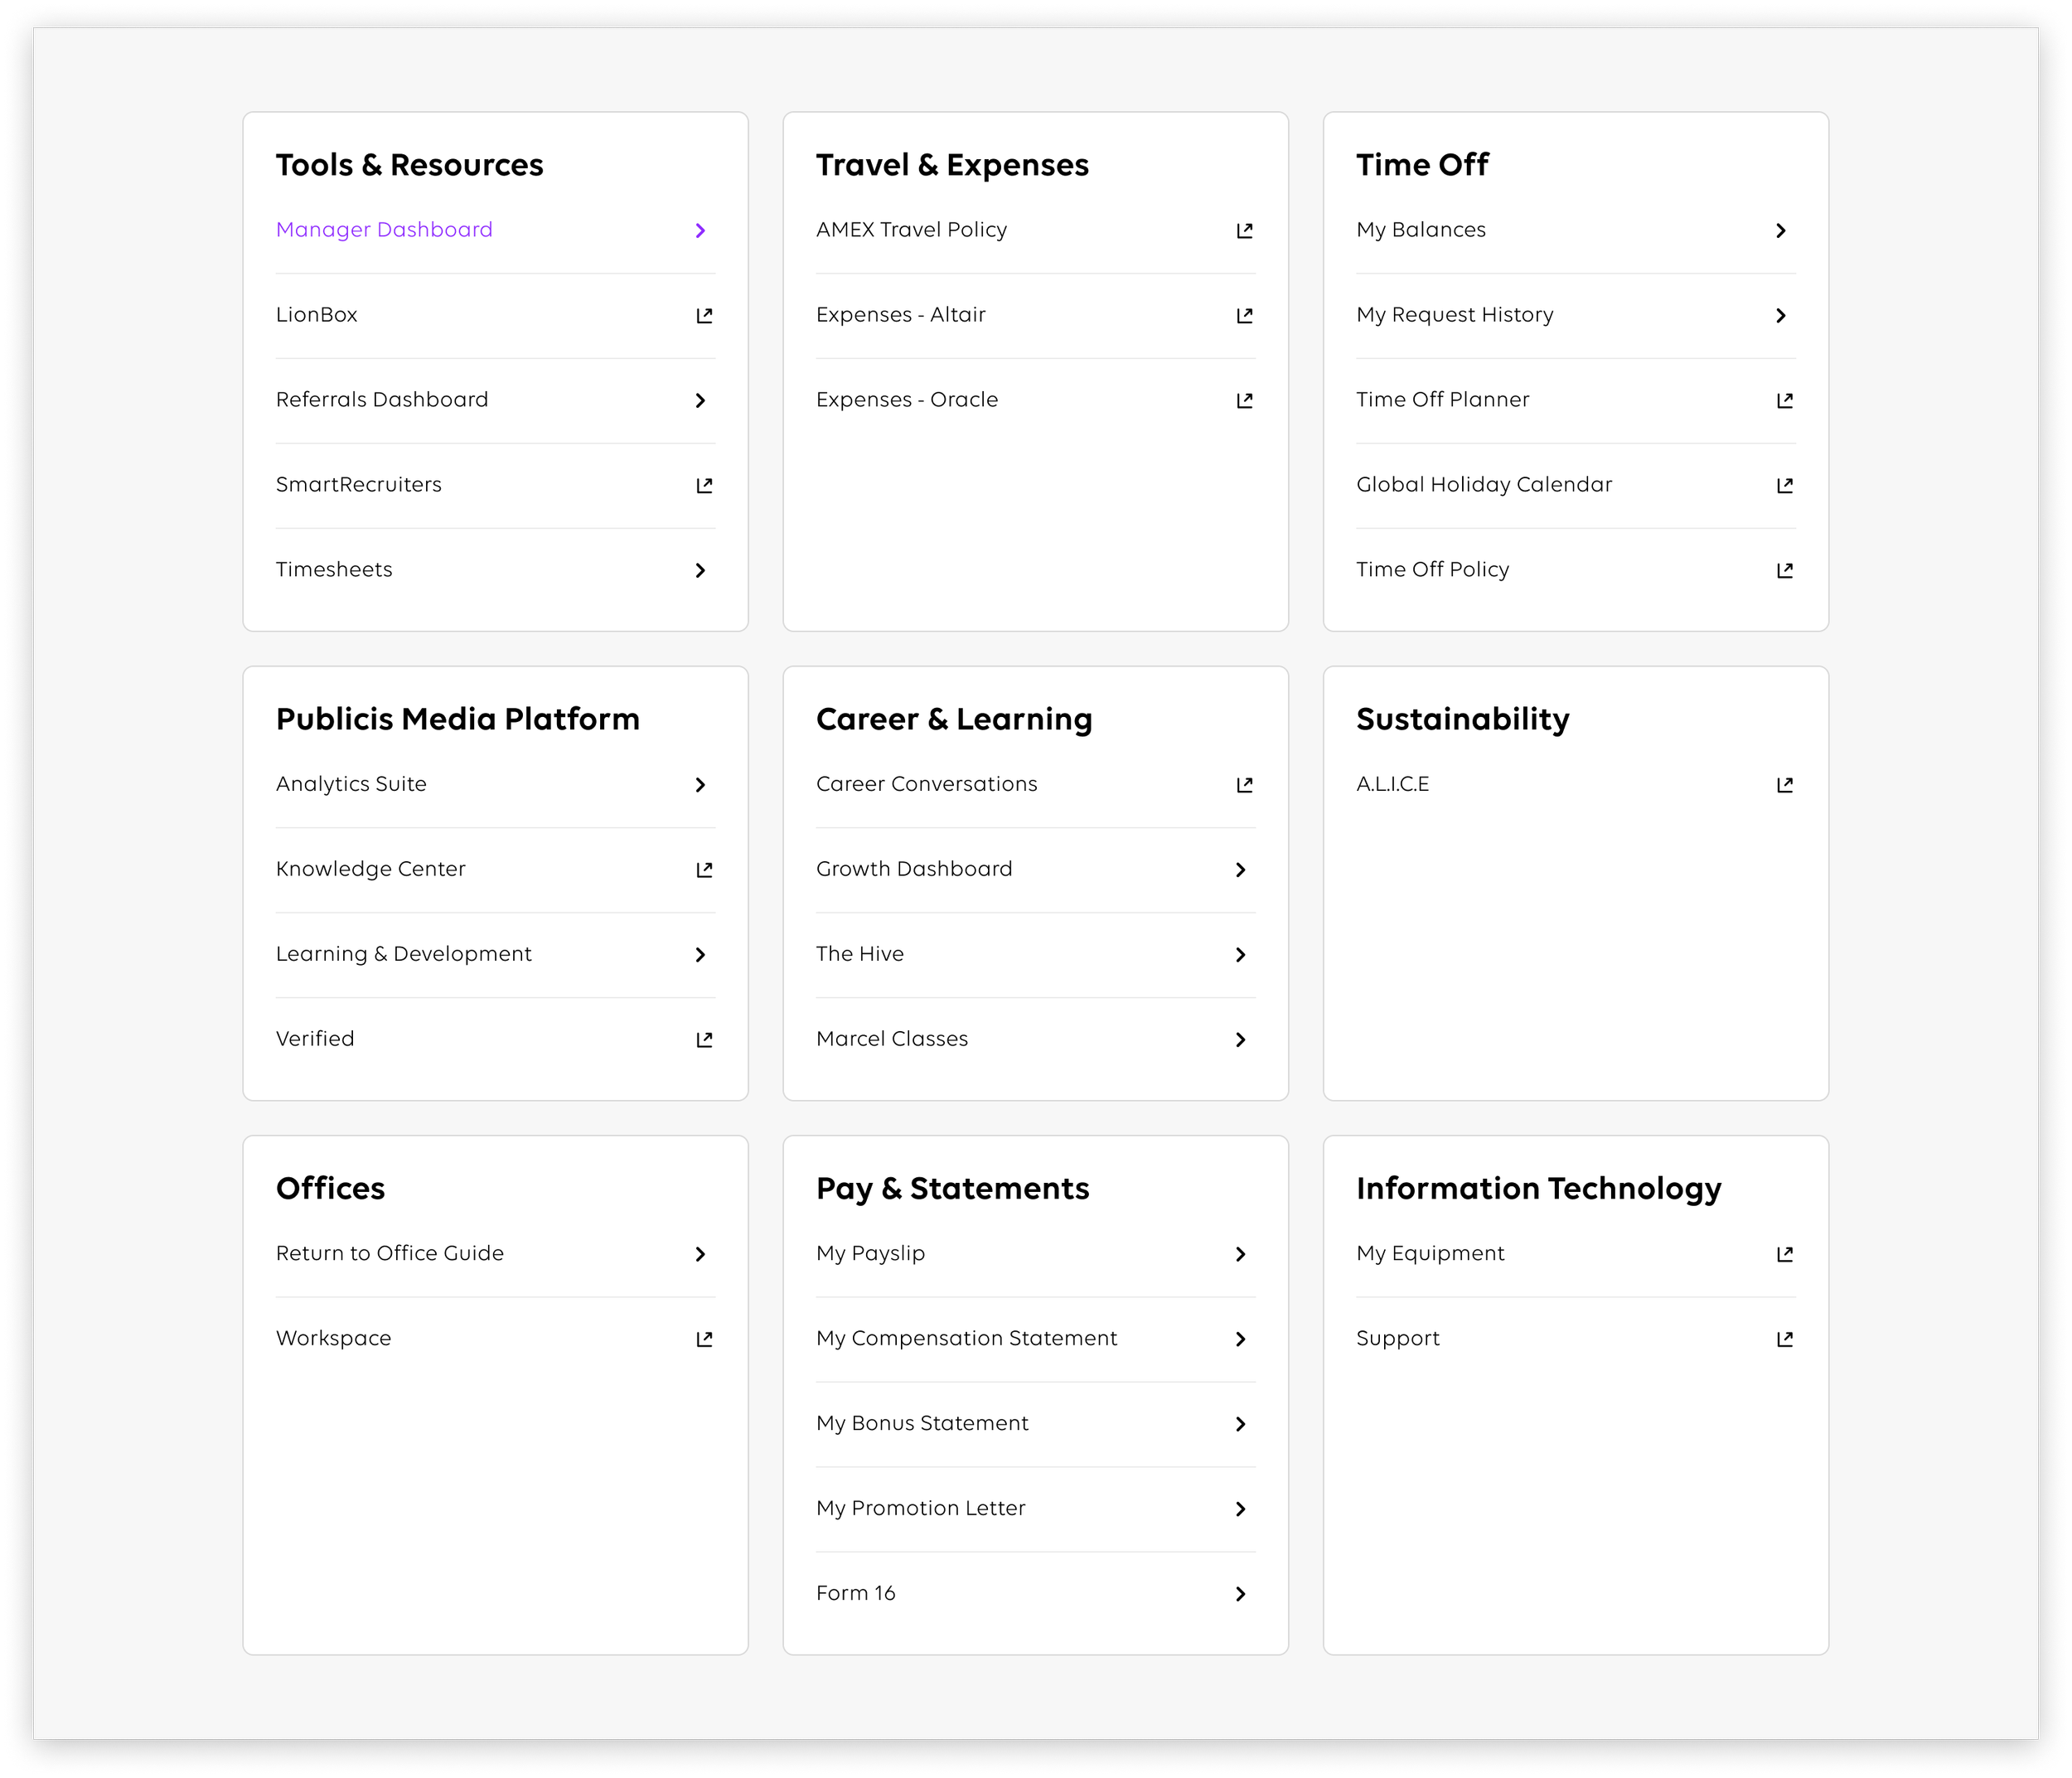
In addition to the placement on Marcel’s global nav, another logical entry point into Manager Dashboard would be from Access Portal. Knowing how closely related the two experiences are yet Manager Dashboard being more of a tool, I place the entry point to Manager Dashboard within Access Portal’s Tools & Resources link tile.
I then researched similar experiences to the one I was setting out to create such as Lattice, Bamboo HR, and even dug into task management platforms such as Monday as a point of reference that could serve as inspiration for the UI components. I combined the early requirements from the brief with some of the more relevant UI references I came across in my research while adhering to our grid and spacing. From there the iterations kicked off.
-
In the eight sprints leading up to the deployment, I worked in tandem with one visual designer to create final max-state screens and happy-path prototypes to share out with stakeholders. Coming out of those reviews the general feedback was to simplify the experience for launch focusing on actions and tasks that were the most frequently used and most important. So I paired back the designs as I prepped for hand off. Through a phased approach, we would plan quarterly in the product roadmap to provide feature enhancements thereafter.
-
This tab allows the manager to view all of their most pressing tasks on a single page. From approving time off requests, timesheets or accessing expense reports, everything is right at their fingertips. A manager can now alert their team of important upcoming events, gently nudge their direct reports to finish their year end reviews and more.
-
This view provides a deeper look into the manager’s direct reports. It’s not just about names, roles, and projects but about uncovering their individual skills and aspirations as well.
Now that a manager is able to access this powerful insight they can encourage personal and professional growth among their team by sharing AI-powered recommendations that include projects, articles, case studies, and classes that all perfectly align with an individual team member’s goals.


Augmenting with AI
Using our own data to meet specific needs by leveraging AI to contextualize and surface smart recommendations to the manager is a key element in the manager’s view of their team.
Providing the manager with a variety of content and learning programs that they could easily recommend to their direct reports right from this expanded view facilitates personalized upskilling and growth opportunities at the individual level. I worked closely with my product manager and our data scientist to ensure logic was formulated based on relevance to the user by drawing from cross-platform data sources to inform the algorithm.


A Milestone & Average Monthly Visits
The launch of Manager Dashboard marks a milestone in streamlining operational workflows. This innovative tool has empowered our managers by automating numerous tasks and communication processes, allowing them to reclaim valuable time. This efficient solution not only enhances productivity but also contributes to a more agile and responsive management approach within our organization.
On average, half of the total manager pool at Publicis Groupe visits this dashboard to perform tasks and connect with their team on a monthly basis. We see these numbers spike as we move into review cycles in the back half of the year.


Results
• Automation of managerial tasks and comms
• Greater insight and an uptick in recommended actions at the team level
• A centralized, transparent, and organized view of the yearly review cycle steps
• A scalable solution for managers that have as few as one direct report and as many as 50+
Next Project